DEKATANAH - Soil Fertility Detection Project
Abstract
Soil is the most used plant growth medium. However, due to various soil conditions, not all plants are also suitable for the particular soil to be used, so a tool or sensor is needed that can read and measure soil fertility. Simple soil fertility measurement can be measured from 2 elements of soil fertility attributes, namely the soil pH element and the soil moisture element. Most of the available soil fertility detection instruments or systems only use one of the soil fertility elements and the data on the detection results can’t be stored for a long period, making the readings less effective. From these problems, we conducted research to build a soil fertility detection system that uses a soil pH sensor and a soil moisture sensor that is connected to the Arduino Nano microcontroller and can be run with an application on a smartphone. The results of this study are in the form of a soil fertility detection tool and system that can read soil pH and soil moisture content and an Android smartphone application that is connected to the device via the USB-OTG feature. With this application, a test location is obtained where the soil is tested and then stored in the TinyDB database in the application so that data will not be lost even if the tool is turned off.
Keywords: soil, fertility, pH sensor, moisture sensor, microcontroller, Android application
Hardware Specifications
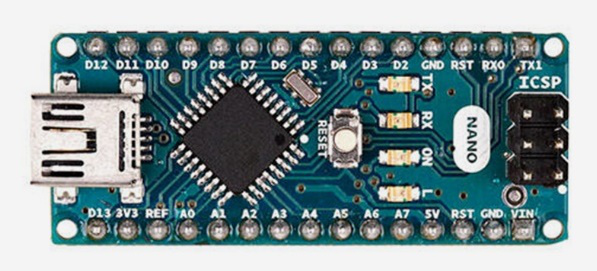
1. Arduino Nano microcontroller
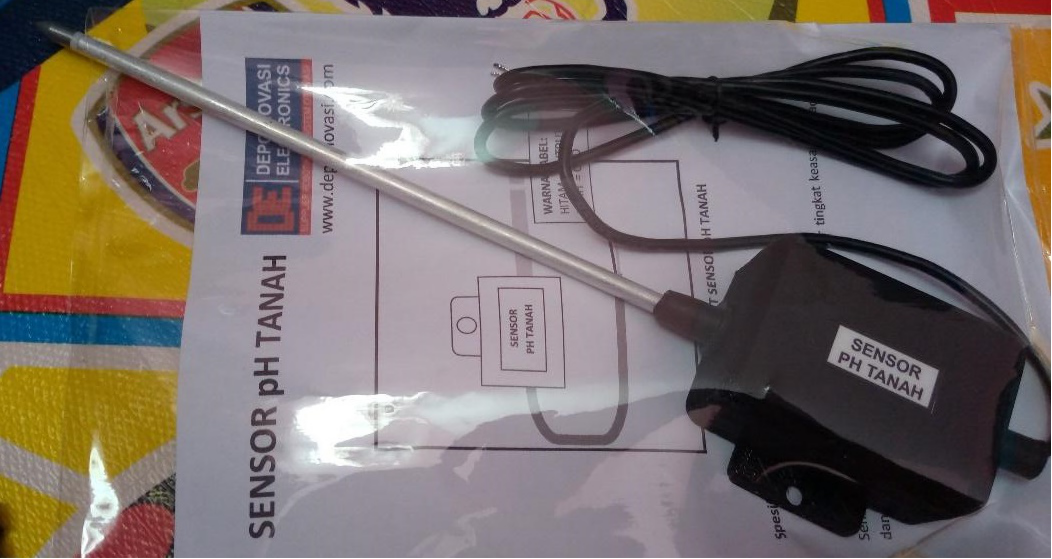
2. Soil pH meter sensor
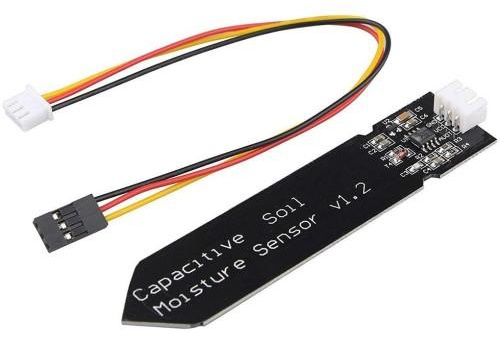
3. Capacitive soil moisture sensor
4. LED lamp indicator
5. Active Buzzer
6. Voltage Regulator
7. Switch/Push button
8. Diode
9. Jumper cable
10. USB-OTG Adapter
11. Micro USB / Type C USB cable (depends on smartphone USB port)
12. Printed Circuit Board
13. Case
14. Smartphone with support for USB On-The-Go, GPS, and Location Sensor
System Design
System Block Diagram
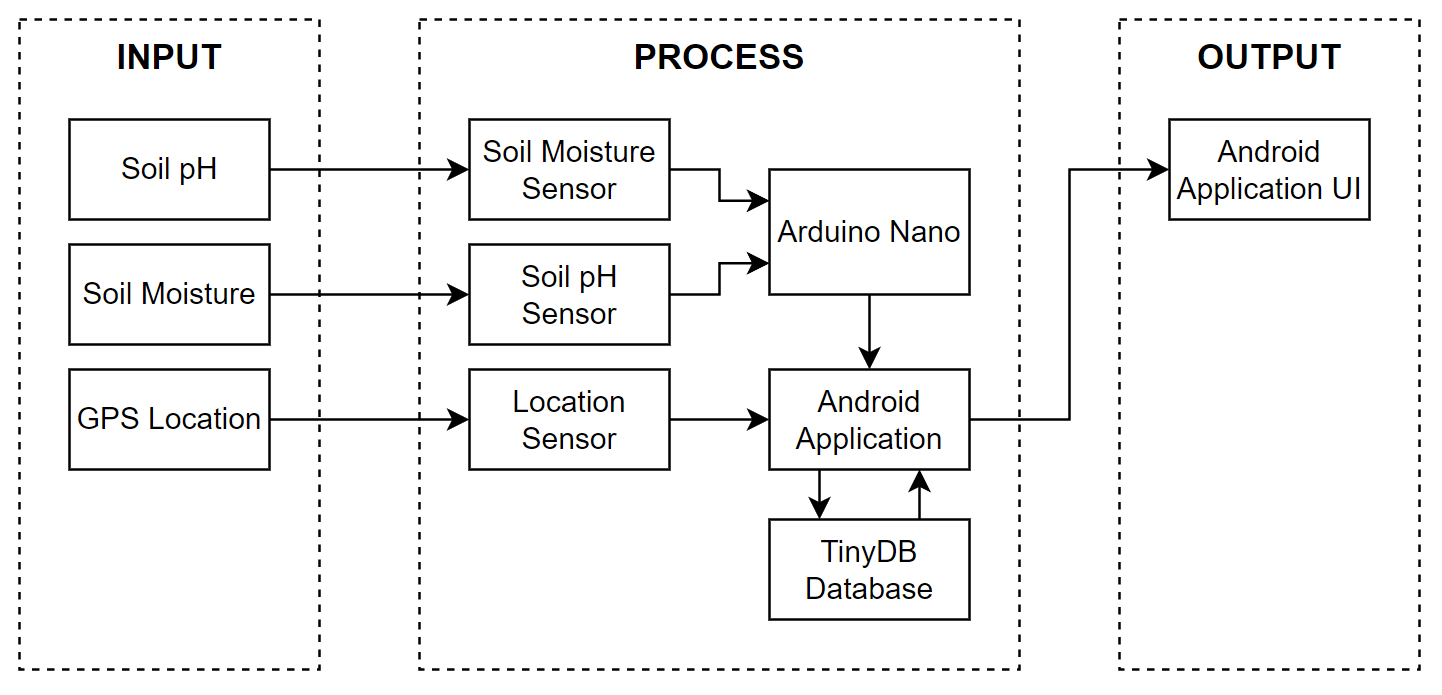
System inputs are soil acidity measured by a soil pH meter sensor, soil moisture measured by a soil moisture sensor, and location read by a location sensor. The data obtained by the soil pH meter sensor and soil moisture sensor are then processed by the Arduino Nano microcontroller to obtain humanized reading data to be sent to the Android application while the location sensor reading data is processed directly by the Android application. TinyDB storage media is used to accommodate data received by the application so that it is not lost when the system is turned off. To display the data, a user interface is created in the form of an Android application that displays location maps, soil acidity data, and soil moisture data.
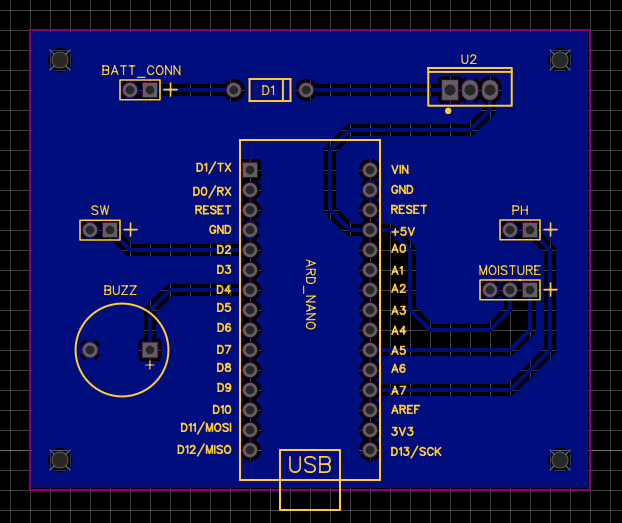
Hardware Schematic

At the top left of the schematic there is a power block to provide additional power if needed. Additional power is obtained from using a 9V battery power source with a voltage regulator to provide a constant 5V output to the microcontroller.
There is also a switch to receive input from the user and a buzzer to give feedback to the user. The switch functions to receive input from the user so that the microcontroller can switch states, while the buzzer functions to provide beep sound feedback to the user as a sign that input has been received and the state has moved.
Hardware System Flowchart
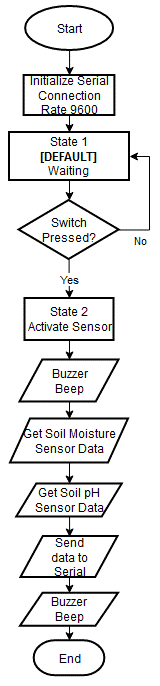
The picture above explains the flow of the data retrieval process on the microcontroller. Starting with the initialization of serial communication with a baudrate of 9600, then the microcontroller will enter the first state, namely “waiting”. In this waiting state the microcontroller will wait for user input in the form of pressing a switch on the tool. If the switch is pressed, the microcontroller will enter the second state, which is to activate and read the sensor. At the beginning of this second state there is a beep from the buzzer as a feedback marker for the tool to start taking measurements: reading values from the soil moisture and pH sensors, sending the result data to the serial, and then produce another buzzer beep as a sign that the measurement has been completed. Then the system returns to the waiting state.
Android App Main Program Flowchart
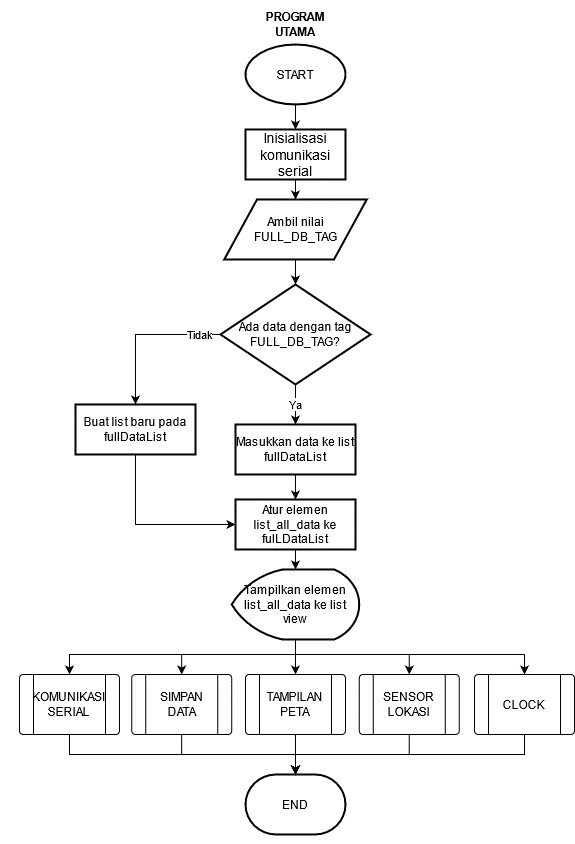
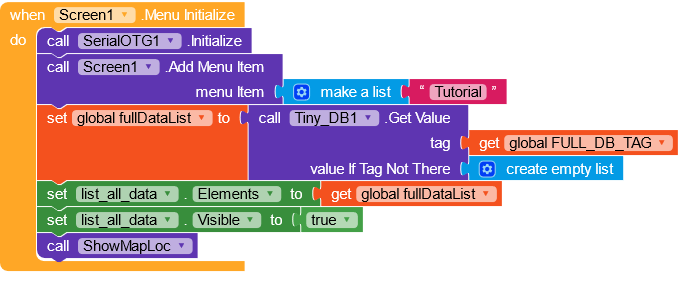
The figure above shows the flow chart of the main program of the Android application. As the main program that will run for the first time, the process performed is the initialization of serial communication, then retrieve data stored in the TinyDB database, display the data and prepare some sub-programs needed.
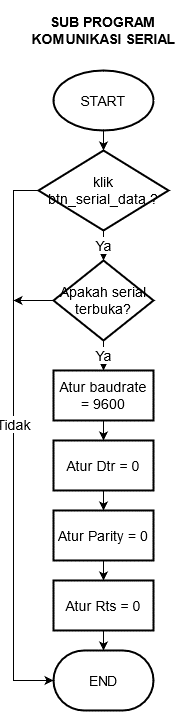
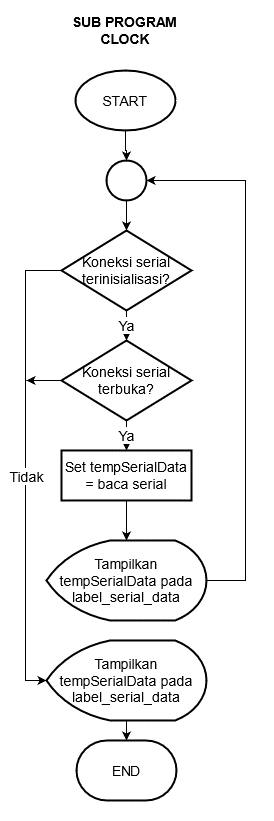
Android App Sub Program Flowchart
- Serial communication
- Clock
- Location sensor
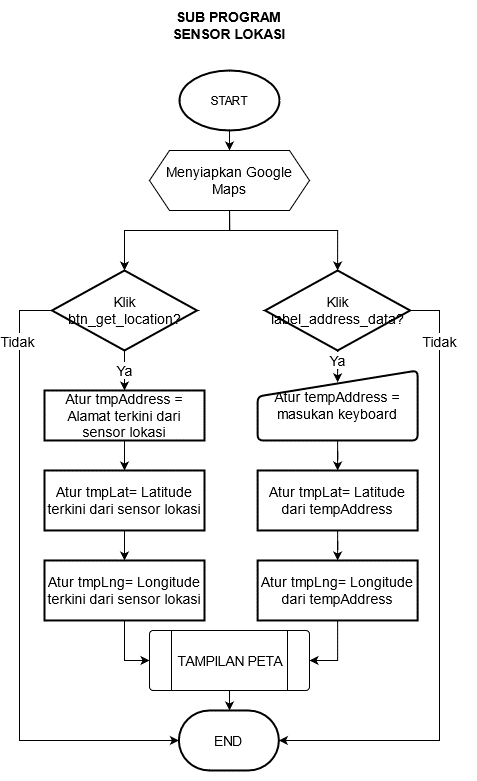
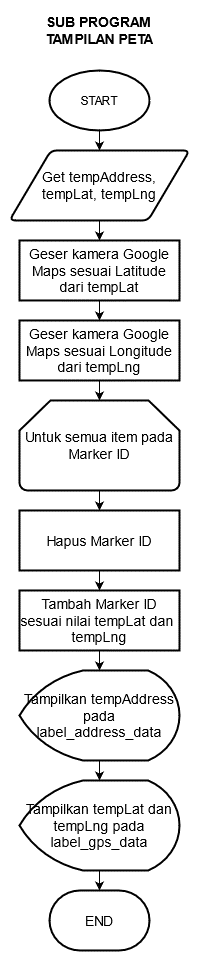
- Show map marker
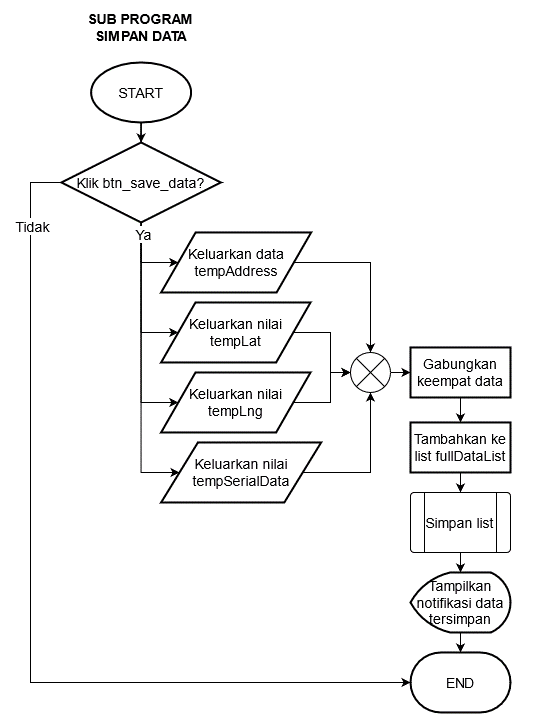
- Save data
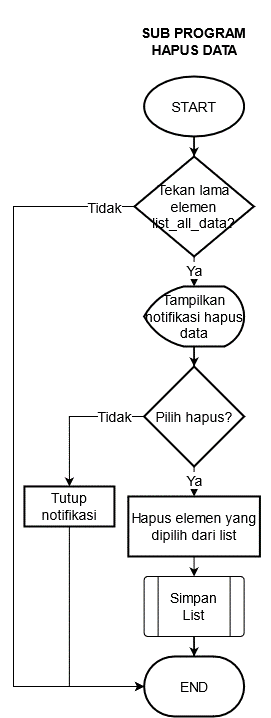
- Delete data
- Save data list
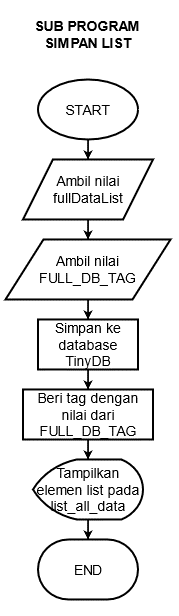
Prototype Implementation
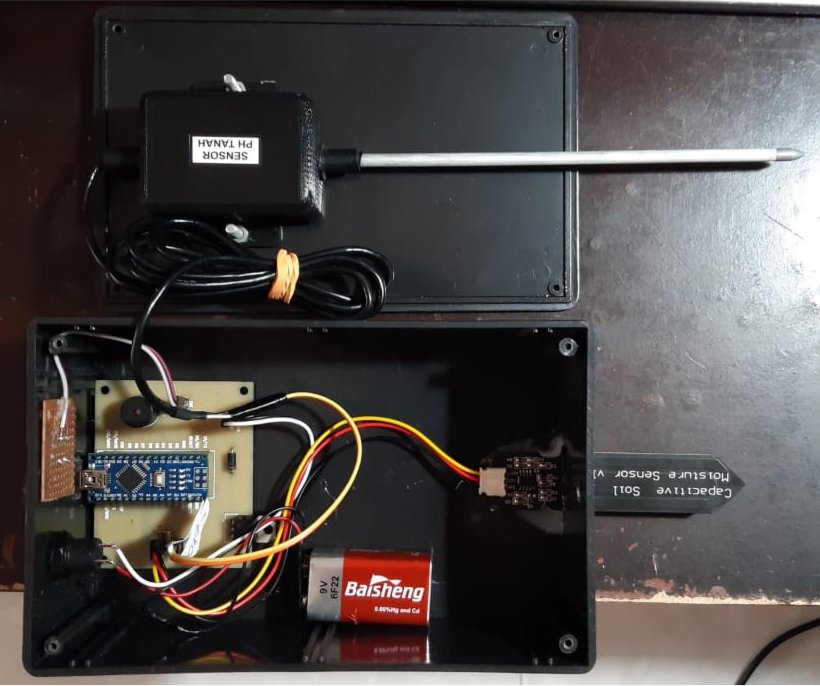
Hardware Prototype
- PCB design
- Final prototype
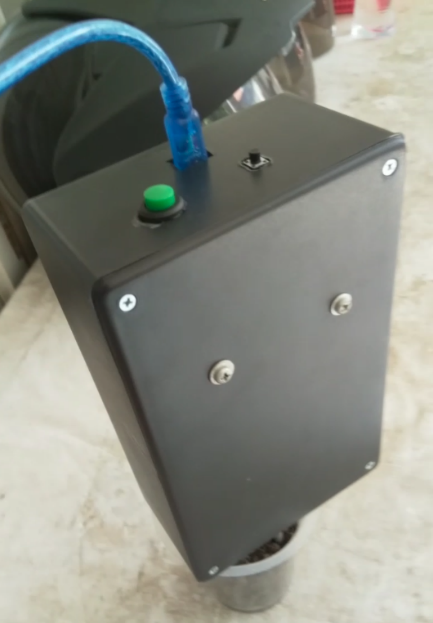
- Prototype on use
Arduino Program
Android Application Program
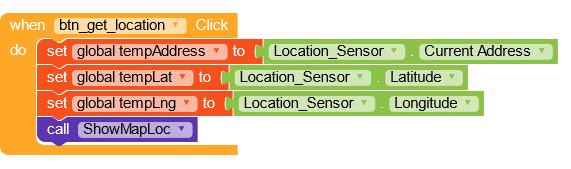
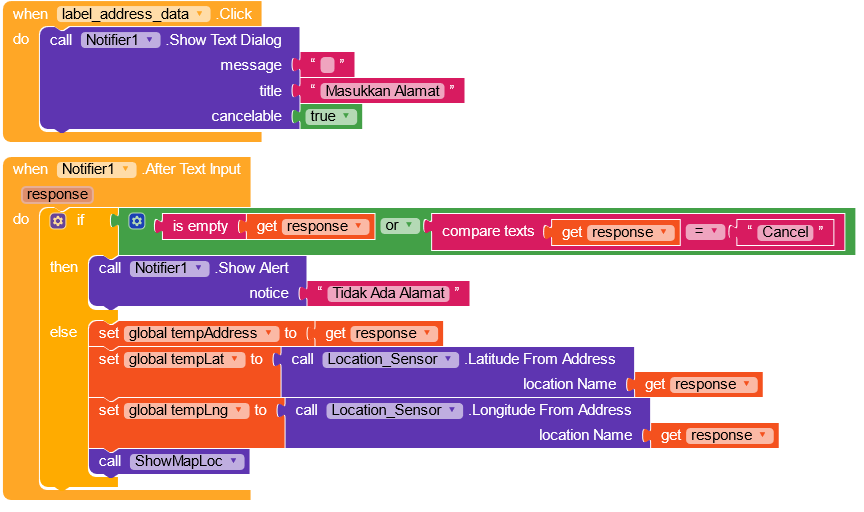
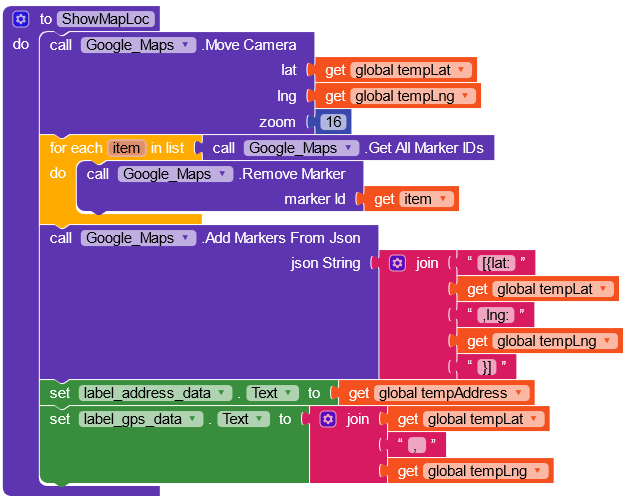
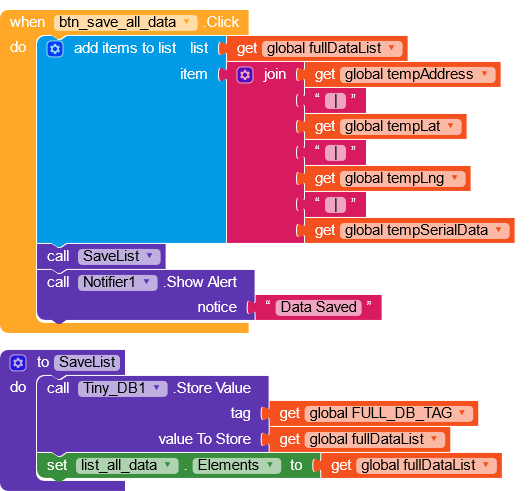
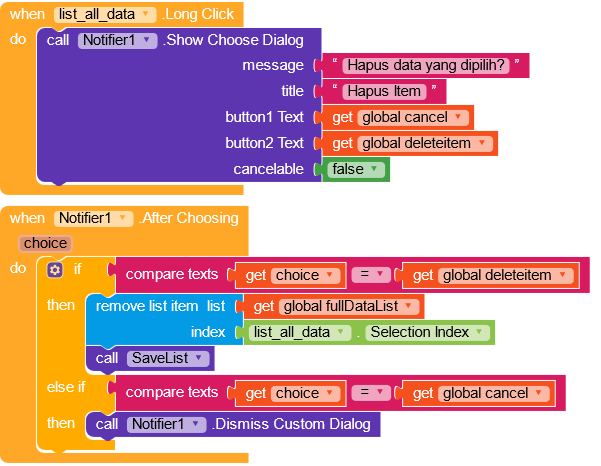
This Android application uses Kodular Blocks, read more: https://docs.kodular.io/
The full image of these blocks can be seen on: kodular-blocks/kodular-blocks.png.
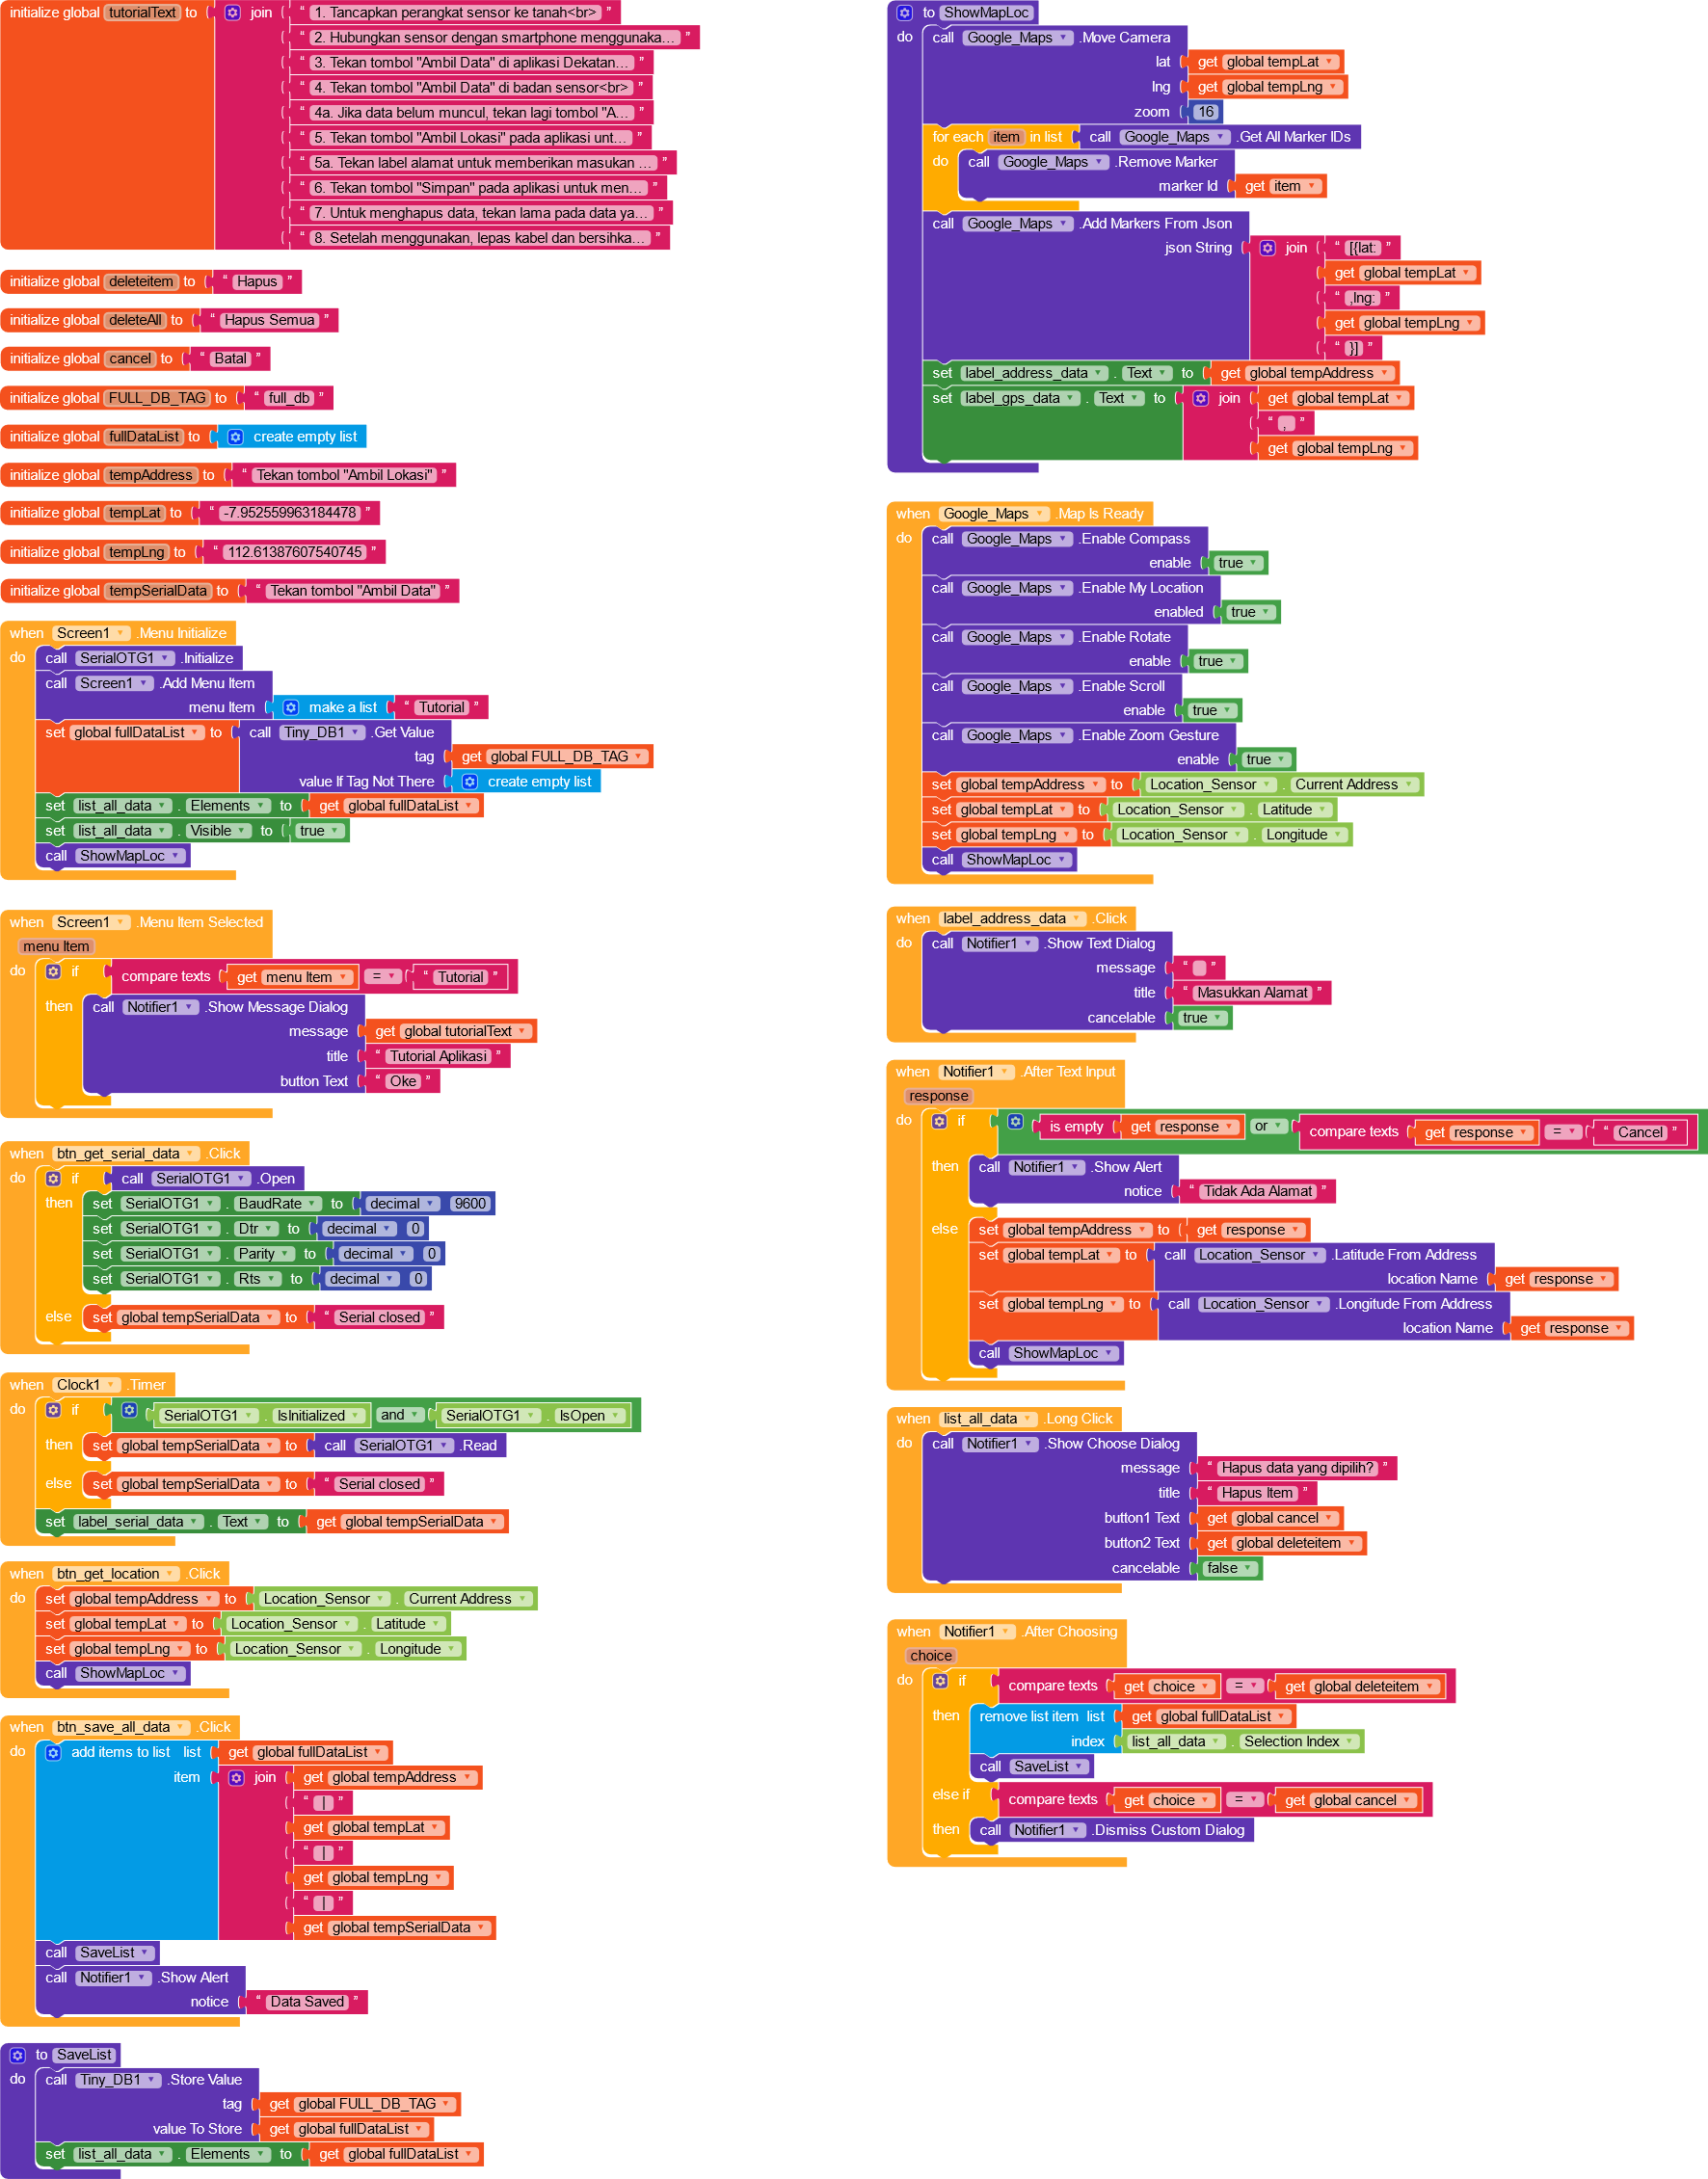
- Main program initialization
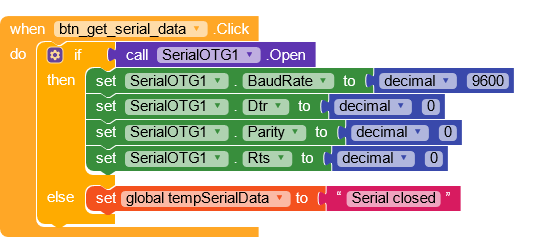
- 0pen serial connection
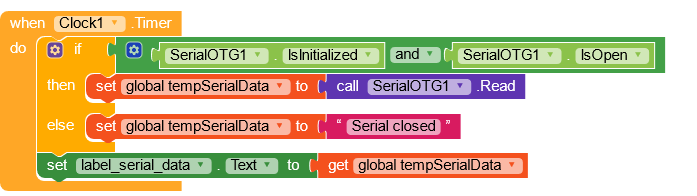
- Read serial data
- Get location
- Address input
- Show location map
- Save data and list
- Delete data
Android Application User Interface
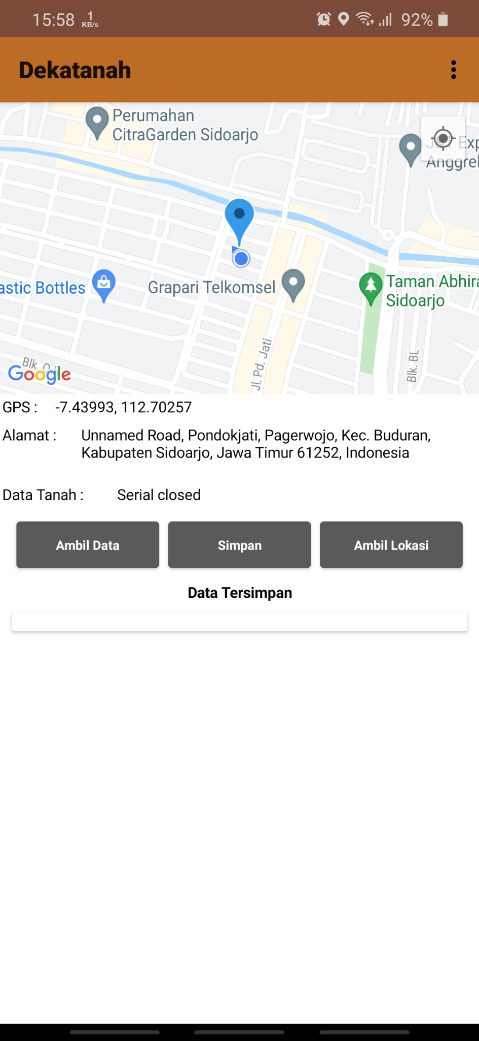
The image above shows the appearance of the application when the “Ambil Lokasi” button is pressed. Once pressed, the application will start the process of reading the current position of the smartphone and the result is a location marker displayed on the map section and the latitude, longitude, and location address values displayed in the reading label section.
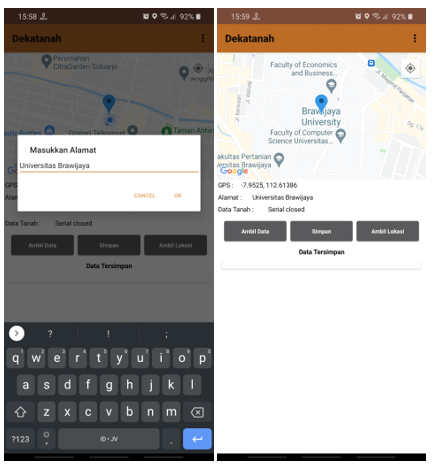
The figure above shows the display of the application when the location reading process uses the manual input feature by pressing the address label. The position of the location marker will adjust to the address entered in the “Masukkan Alamat” dialog.
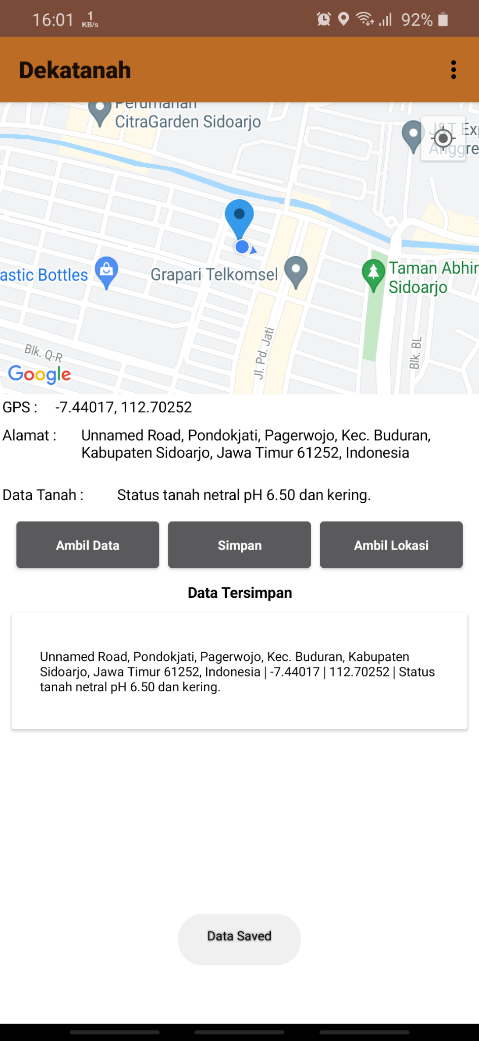
The image above shows the appearance of the application when the “Save” button is pressed. The application will save the location data and serial data to the TinyDB database and displayed in the “Data Tersimpan” display section. If the saved data exceeds the lower limit of the application, a scrolling feature will appear on the “Data Tersimpan” display so that further data can still be seen.
End Notes
Conclussion
- The design of a soil fertility detection system utilizes the Arduino Nano microcontroller, pH sensor, and soil moisture sensor to get data on soil condition. soil conditions. Equipped with an Android application to read location and store detection result data.
- The system is able to measure soil acidity and soil moisture and display it as serial data. The output results displayed have been made in such a way so that it is easy to read and understand for anyone.
- The Android application created is able to detect location by utilizing the location sensor embedded in the smartphone. The accuracy of this location reading is greatly influenced by the quality of the location sensor on the smartphone. This Android application has also been able to receive and store serial data sent by the microcontroller. Data storage is done locally by utilizing utilizing the TinyDB database.
Suggestion
- Implementation of soil pH sensor and soil moisture sensor in this research does not have comparison data with other sensors, so the accuracy obtained cannot be ascertained. In the future, comparison of several sensors should be done to find out the best quality sensor.
- The data storage media in this system only uses the Android application and is saved locally. In the future, the data saving could be done by using cloud-based databases and other applications such as website that can be accessed from anywhere.
Reference
- Dekatanah Github Repository
- Alfeno, S. dan Devi, R.E.C., 2017. Implementasi Global Positioning System ( GPS ) dan Location Based Service ( LSB ) pada Sistem Informasi Kereta Api untuk Wilayah Jabodetabek. Sisfotek Global, [online] 7(2), pp.27–33. Available at: https://journal.stmikglobal.ac.id/index.php/sisfotek/article/view/146 [accessed 1 April 2021].
- Anwar, K., Syauqy, D. dan Fitriyah, H., 2018. Sistem Pendeteksi Kandungan Nutrisi dalam Tanah Berdasarkan Warna dan Kelembapan dengan Menggunakan Metode Naive Bayes. Jurnal Pengembangan Teknologi Informasi dan Ilmu Komputer, [online] 2(9), pp.2491–2498. Available at: http://j-ptiik.ub.ac.id [accessed 15 April 2021].
- Darnila, E., Ula, M. dan Halim, A., 2020. Implementasi Enkripsi Pesan Text Menggunakan Algoritma Vigénere Chiper ( Studi Kasus Pemograman Dev- C ++ ). Jurnal Teknologi Terapan dan Sains, [online] 1(1), pp.91-99. Available at: https://ojs.unimal.ac.id/index.php/tts/article/view/3248 [accessed 1 April 2021].
- McRoberts, M., 2011. Beginning Arduino. Technology in action. [e-book] Apress. Available at: Google Books https://books.google.co.id/books?id=H6W0U1z4NeoC [accessed 1 April 2021].
- Muhamad Alda, S.K.M.S.I., 2020. Aplikasi CRUD Berbasis Android Dengan Kodular Dan Database Airtable. [e-book] Media Sains Indonesia. Available at: https://books.google.co.id/books?id=KygEEAAAQBAJ [accessed 1 April 2021].
- Munawar, A. dan Frandy, Y.H.E., 2018. KESUBURAN TANAH DAN NUTRISI TANAMAN. [e-book] PT Penerbit IPB Press. Available at: Google Books https://books.google.co.id/books?id=zzESEAAAQBAJ [accessed 1 April 2021].
- Prasetyo, T.F., Frastya, E.A. dan Enda S, E., 2018. Sistem Pendeteksi Kesuburan Tanah Pada Desa Cihaur Kelompok Tani Bina Mandiri. Prosiding Seminar Nasional Energi & Teknologi (Sinergi), [online] pp.191–198. Available at: http://jurnal.unismabekasi.ac.id/index.php/sinergi/article/view/850 [accessed 15 April 2021].
- Rima, R.D., Wildian, W. dan Firmawati, N., 2018. Rancang Bangun Prototipe Sistem Kontrol pH Tanah Untuk Tanaman Bawang Merah Menggunakan Sensor E201-C. Jurnal Fisika Unand, [online] 7(1), pp.63–68. Available at: http://jfu.fmipa.unand.ac.id/index.php/jfu/article/view/331 [accessed 15 April 2021].
- Triansah, A., 2017. Authentifikasi Login User pada Perangkat Lunak Menggunakan Arduino dan Enkripsi AES 256. EXPERT: Jurnal Manajemen Sistem Informasi dan Teknologi, [online] 7(2), pp.90-95. Available at: http://jurnal.ubl.ac.id/index.php/expert/article/view/968 [accessed 15 April 2021].
Comments powered by Disqus.